On this page
Analytics is at Analytics in the dashboard, and needs the admin role. An agent who opens it is told which role it needs. In this article, "lead" means whatever your workspace calls the people who write in; the page uses your word.
What is counted, and what is not
Every figure excludes playground conversations. They are simulated — you talking to your own bot — and counting them would inflate your lead volume and, worse, wreck your averages: a playground lead is qualified in minutes rather than days, so a handful of them drag "average days to qualify" towards zero and quietly make the number meaningless.
The exclusion is total. Volume, funnel, outcomes, averages, the reasons leads were lost: none of them can see a simulated lead. Days are counted in UTC, not in your own time zone.
The overview
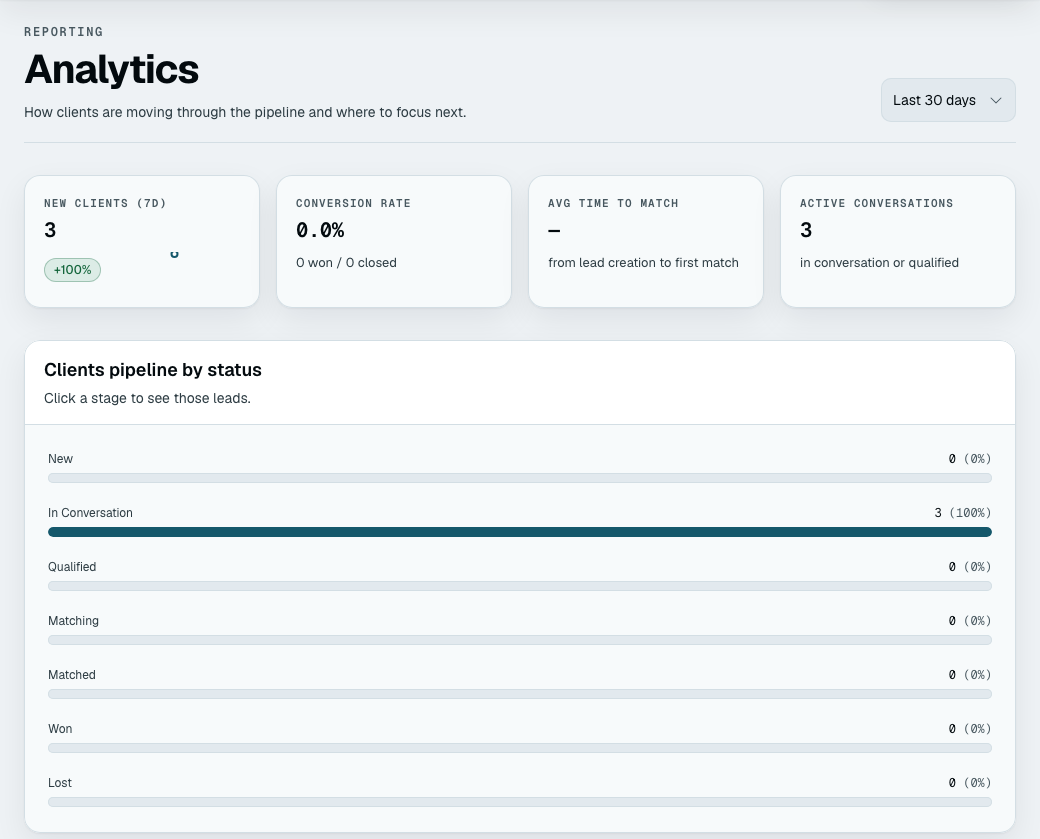
Available on every plan. Four figures sit across the top, and none of them follows the range control below them.
| Figure | What it counts |
|---|---|
| New leads (7d) | New leads in the last 7 days, with a comparison against the 7 days before (the comparison and the trend line need the advanced analytics feature) |
| Conversion rate (all time) | Won out of won plus lost, for every lead ever closed |
| Avg time to match (all time) | Arrival to first match, for leads that were matched |
| Active conversations (now) | Leads in conversation or qualified right now |
Under them, pipeline by status shows where every real lead sits now: New, In conversation, Qualified, Matching, Matched, Won and Lost. Select a stage to open Leads filtered to it.
Additional metrics at the foot of the page holds the totals and averages the top row has no room for:
| Figure | What it counts |
|---|---|
| Total leads, total records | Every real lead, and every record in your pool (your template's sample records included, the playground's examples not) |
| Leads this week / this month | New leads in the last 7 and 30 days |
| Avg days to qualify | Arrival to qualification, for leads that got there |
| Avg days to win | Arrival to closed-won, for leads that got there |
| Avg match score | The average score of the matches made, out of 100 |
| Matches created | How many matches have been made |
The averages only include leads that reached the stage. A lead still in conversation is not counted as a slow qualification — it is not counted at all. That makes the averages honest about the leads that completed and silent about the ones in flight, which is the right trade but worth knowing when a number moves for no obvious reason.
The trend reports
These reports need the advanced analytics feature — check the pricing page for which plans include it. If yours does not, the overview is still fully available, and each report says it comes with a plan that includes it, with a single See plans button at the top for the owner.
| Report | Shows | Window |
|---|---|---|
| Volume | New leads per day | 7, 30 or 90 days, your choice |
| Won vs. lost | Closed leads in the window, won against lost, and the win rate | 7, 30 or 90 days, your choice |
| Why leads were lost | Why leads were closed as lost, most common first | All time |
| Qualified, by channel | The share of each channel's new leads that passed your rules | Last 30 days |
| When leads message | First messages by weekday and three-hour band, in UTC | Last 30 days |
| Negotiation | Leads that missed a negotiable rule, how many were settled in the chat, accepted an offer or were accepted by your team, and your most-accepted offers | Last 30 days |
| Options | Leads shown options, how many chose one, how many said none fit and why, and how many won after choosing | Last 30 days |
| Bookings | Calls booked, and how many were completed, cancelled or missed; how many were won afterwards; and how many leads did not book a time | Last 30 days |
The range control (7 days, 30 days, 90 days) sits above the first two reports and governs only those two. Ninety days is the longest it goes.
The Negotiation tile
It answers one question: are your offers doing anything? It counts real leads that missed a negotiable rule and were active in the last 30 days, and of those, how many were settled in the conversation, how many accepted an offer, and how many your team accepted anyway. Below that it lists the three offers leads accept most. The three counts can overlap, because one lead can do more than one. An offer you have since removed is left out of the list.
If nothing has been missed yet it says so. Conversations in the playground are never counted. How to write offers: What your bot may offer.
The Options tile
It answers: are leads picking from what your bot shows them? It counts real leads who were shown options in the last 30 days (by the bot or by your team), then how many chose one (as a share), how many said none fit and the most common reason they gave (Price, Dates, Location, Size, Style or Something else), how many did not reply, and how many of those who chose went on to win. Only a lead's current enquiry counts. It shows no record names. A lead who said none fit and then picked from the second set counts as having chosen. A lead who gave no reason is in "none fit" and in no reason. Until options are on, and a lead has been shown some, it says so. Chats in the playground are never counted. How options work: Showing options to leads.
The Bookings tile
It answers: are your leads booking the next step, and does it lead to anything? It counts the calls, visits and meetings booked in the last 30 days, then splits them:
- Completed, cancelled, no-show and still to come. These four never overlap, and they add up to the calls booked. A call that has ended and that nobody marked is still "to come" until someone presses Completed or No-show on the booking card, so marking them is what keeps this honest (the booking card).
- Booked, then won. How many of those calls were with a lead that went on to be won. It includes a call that was cancelled: the question is whether booking led to a sale, not whether this call happened.
- Didn't book a time. How many leads reached your team with the reason "Didn't book a time" in the window. This is counted on its own and is not part of the calls booked. It holds every way a lead can end without a booked time: no time was free, none of the times suited, they said no, they went quiet, they cancelled and did not rebook, or they missed their call. Open Needs you to see which. A rising number with "No free time in the next … days" on the leads means your hours, your notice or your days ahead are too tight (Your hours).
Things worth knowing:
- A move is one call, not two. When a call is moved, the old time is not counted as cancelled; only the new booking is counted.
- Only real leads count. Calls booked in the playground are never counted. Days are counted in UTC.
- A workspace with a great many bookings is counted from its newest 5,000 in the window.
- A booking page of your own is not tracked. A lead who books on it does not appear here (the booking page).
- It needs the advanced analytics feature, like the other trend reports, and the admin role. Until booking is on and a call has been booked, the tile says so.
Why leads were lost is worth reading first
This report groups every lead closed as lost by the reason recorded on it, most common first, over all time. For a lead the bot turned away, or one your team held and then declined, that is the reason written on the rule that failed — which means it is exactly as useful as the reasons you wrote. Leads closed for other reasons appear too, under their own: not_interested for a lead who opted out, unresponsive for one who went quiet and was closed, and Unknown where none was recorded. A lead you Reconsider leaves the report.
"Budget below minimum" appearing forty times is a finding: either your floor is too high or your marketing is reaching the wrong people. "no" appearing forty times is not.
If the report is unreadable, the fix is in Qualification rules, not here.
Questions the numbers can answer
- Is the bot finishing conversations? Compare leads in conversation against leads qualified. A pile in conversation usually means a required question people cannot answer.
- Are the rules too tight? Why leads were lost, against your total volume.
- Is matching helping? Average time to match and average match score, against how many leads reach Matched and then Won. Plenty of matches and few wins means the ranking is not earning its place, and weights are where to look.
- Which channel brings the leads that qualify? Qualified, by channel.
- When do people write? When leads message shows the busiest weekdays and hours, in UTC.
- Is anything reaching us at all? If lead volume is zero and you expected otherwise, this is not an analytics question — Webhooks is.